When investors talk about market crashes, the conversation usually circles around the “usual suspects”—rising interest rates, inflation spikes, or geopolitical tensions. But history tells us that markets rarely collapse from the obvious. The real warning signs often lurk beneath the headlines, quietly building pressure until one small spark ignites the fire.
Today, three lesser-known but powerful red flags are flashing simultaneously. They’re not the ones plastered across financial news every day, but if you’re paying attention, they’re screaming that risk is at a dangerous tipping point.
Let’s break down these three red flags—and why they may be signaling a storm far bigger than most people expect.
Red Flag #1: Corporate Earnings Are Propped Up by Buybacks, Not Growth
At first glance, earnings reports look healthy. In 2024, U.S. companies in the S&P 500 still managed to show year-over-year earnings growth. But peel back the surface, and the picture looks very different.
- Stock buybacks hit $925 billion in 2023 (S&P Dow Jones Indices), and 2024 is on pace to match that figure.
- According to FactSet, more than 40% of earnings-per-share (EPS) growth over the past five years can be attributed not to actual business expansion, but to buybacks reducing the number of shares outstanding.
- Revenue growth is slowing, margins are tightening, and yet EPS looks “strong” only because companies are financially engineering the optics.
This is dangerous because it creates a false sense of resilience. Investors believe corporate America is thriving, when in reality, balance sheets are stretched, debt levels are near all-time highs, and productivity growth is stagnant. Buybacks mask fragility—until credit markets tighten, and suddenly the rug is pulled out.
The last two major collapses (2000 and 2008) were preceded by an eerily similar divergence between “engineered” earnings and actual economic productivity.
Red Flag #2: Bond Market Inversions Aren’t Just Flashing—They’re Screaming
Wall Street has always viewed the inverted yield curve as the most reliable recession predictor. And right now, it’s deeper and longer than at any point since the early 1980s.
- The 10-year minus 2-year Treasury yield inversion has lasted more than 18 months, a record streak.
- Historically, every single U.S. recession since 1955 was preceded by an inversion of this curve.
- The lag time? Typically 6 to 24 months. That means the real pain hasn’t even arrived yet.
But here’s the twist: It’s not just the inversion—it’s the magnitude and the global synchronization. Bond markets in Germany, Japan, and the UK are showing similar distortions, meaning it’s not a localized U.S. problem. It’s systemic.
The bond market is often called the “smart money” because it reflects institutional expectations of growth, inflation, and default risk. When bonds scream “danger,” equities eventually listen.
The mainstream narrative says, “The Fed may engineer a soft landing.” But the bond market is saying otherwise. If history holds true, stocks could be sitting on a trapdoor that opens in the next 6–12 months.
Red Flag #3: Retail Investors Are All-In—Right Before the Cliff
Here’s one of the most underappreciated indicators: retail investor positioning.
The latest data from Vanda Research shows that U.S. retail investors poured an average of $1.5 billion per day into stocks and ETFs in early 2024—a pace not seen since the meme-stock mania of 2021. Trading volumes in high-risk options, particularly zero-day-to-expiration (0DTE) contracts, hit record highs.
Meanwhile:
- Household exposure to equities as a percentage of total financial assets is at 45%, the second-highest level on record (the peak was right before the dot-com crash).
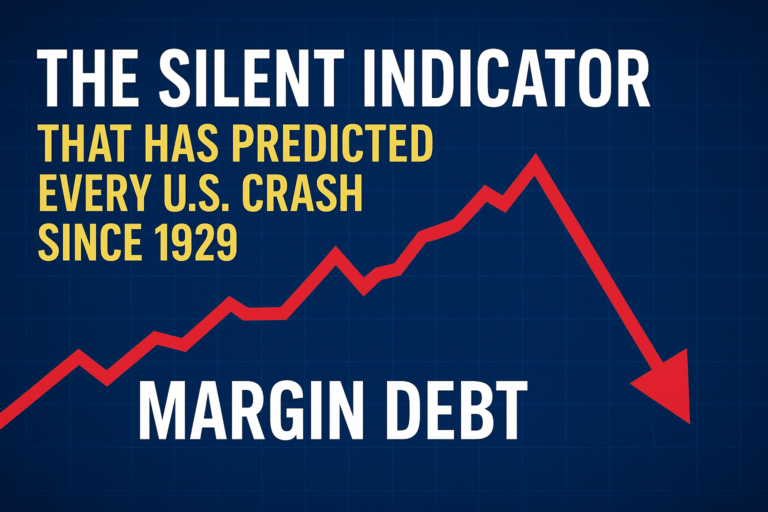
- Margin debt—borrowed money used to buy stocks—climbed back above $700 billion, dangerously close to the levels seen before the 2022 bear market.
- Surveys show retail investors are the most bullish since 2021, even as institutional money managers are quietly rotating into safer assets.
Historically, retail investors pile in at the top—right before the professionals exit. This happened in 1929, 2000, and 2007. It’s happening again today.
Why These Three Together Spell Trouble
Individually, each of these indicators is worrying. Together, they’re a cocktail for disaster:
- Artificial earnings support → masks weakness until credit dries up.
- Bond market inversion → signals recessionary conditions are unavoidable.
- Retail all-in positioning → adds fuel to the downside once selling begins.
Markets don’t collapse from a single cause. They collapse when multiple vulnerabilities converge—and that’s exactly what’s happening now.
What Investors Should Watch Next
The million-dollar question: When does the collapse happen? Timing is always the hardest part, but here are catalysts that could accelerate the cracks:
- A wave of corporate downgrades as debt refinancing costs surge.
- Unemployment finally ticking up, forcing the Fed to choose between inflation control and growth support.
- A liquidity shock in credit markets, especially in high-yield debt.
No one rings a bell at the top of the market. But when three of the most reliable, non-obvious indicators align like they do today, the smart move is not to ignore them.
The Bottom Line
It’s easy to get swept up in the daily noise—jobs reports, Fed speeches, CPI releases. But investors who survive downturns aren’t the ones who react to headlines. They’re the ones who notice the subsurface tremors before the earthquake hits.
Right now, those tremors are here: buybacks disguising weak growth, bond markets screaming recession, and retail investors betting the house at exactly the wrong time.


