When markets crash, it always feels sudden. Investors look back afterward and ask: “What were the signs we missed?” The truth is, there’s one silent indicator that has consistently flashed before every U.S. stock market collapse since 1929.
It’s not interest rates. It’s not GDP. It’s not even corporate earnings.
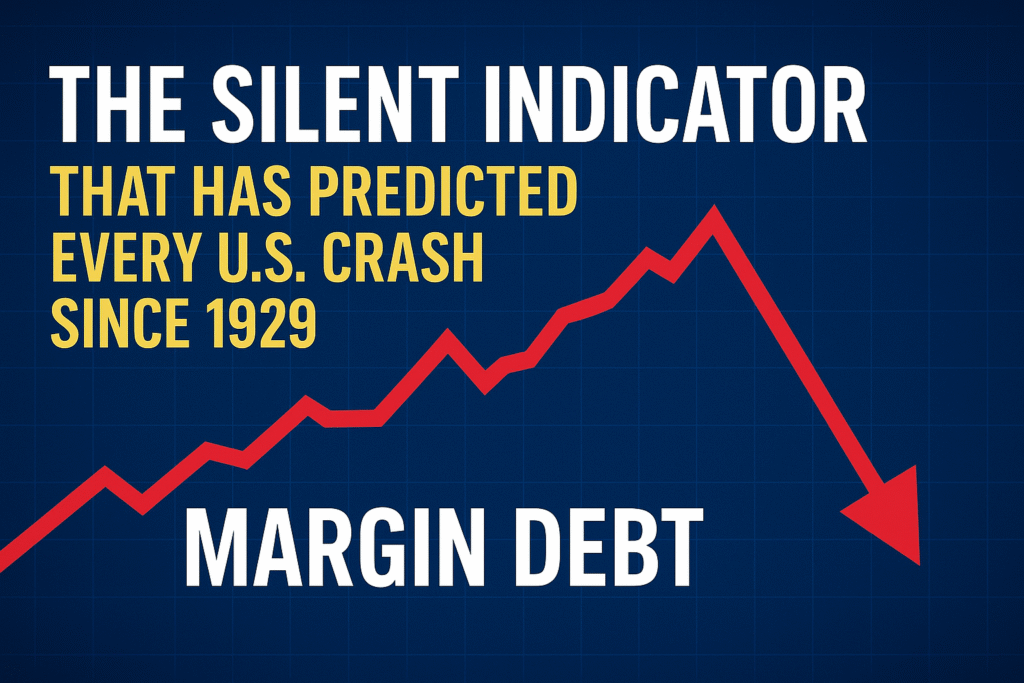
It’s margin debt—the amount of borrowed money investors use to buy stocks.
This under-the-radar metric doesn’t make front-page news. But history proves that when margin debt soars to extreme levels, the market’s foundation becomes fragile. And when it reverses? The crash follows.
Let’s break down why this indicator matters, what the data shows, and why it could be flashing red again today.
What Is Margin Debt?
Margin debt is money borrowed from brokers to purchase stocks. It allows investors to leverage their positions—magnifying gains when markets rise, but also magnifying losses when markets fall.
Think of it like gasoline. In moderation, it fuels growth. But too much of it turns the market into a tinderbox. One spark, and everything burns faster than expected.
The New York Stock Exchange (NYSE) has tracked margin debt for decades, and the numbers tell a clear story: every major U.S. crash was preceded by a surge in margin borrowing.
History Never Lies: Margin Debt and Market Crashes
1929 – The Great Depression
In the roaring 1920s, investors could buy stocks with as little as 10% down, borrowing the rest on margin. By 1929, speculative leverage was so extreme that when the market turned, margin calls forced mass liquidations. The Dow Jones plunged nearly 90% over the next three years.
2000 – The Dot-Com Bust
According to the NYSE, margin debt hit a record $278 billion in March 2000. At the exact same time, the Nasdaq peaked. When tech stocks collapsed, margin calls accelerated the selloff. The Nasdaq fell nearly 78% from its high.
2007–2008 – The Global Financial Crisis
Margin debt reached $381 billion in mid-2007, right before the S&P 500 topped out. When subprime mortgages cracked the system, forced liquidations deepened the collapse. By March 2009, U.S. stocks had lost over 50% of their value.
2020 – COVID Crash
In February 2020, margin debt was near record highs at $561 billion. When the pandemic panic hit, selling pressure cascaded. The S&P 500 dropped 34% in just five weeks—the fastest bear market on record.
2021–2022 – The Post-Pandemic Bubble and Bust
Margin debt exploded during the retail trading boom, peaking at $936 billion in October 2021. Soon after, tech stocks began to slide, and the S&P 500 lost nearly 25% in 2022.
The pattern is undeniable: spikes in margin debt have always preceded or coincided with major downturns.
Why Margin Debt Is the “Silent Indicator”
Unlike flashy economic data, margin debt doesn’t get mainstream media coverage. But it’s the ultimate measure of investor sentiment and risk appetite.
- When optimism is extreme, investors borrow aggressively.
- When fear strikes, brokers issue margin calls (demanding repayment). This forces investors to sell stocks—even at a loss—triggering a cascade of selling.
- Because it happens so quickly, crashes often feel sharper and more violent than expected.
In short: margin debt shows how much speculative fuel is in the market. And history shows that once the fuel runs out, markets crash.
What the Numbers Say Today
So where are we now?
- According to FINRA, margin debt stood at $737 billion in July 2024. That’s down from the $936 billion peak in 2021, but still above pre-pandemic levels.
- More importantly, the rate of change matters as much as the absolute number. Historically, crashes follow not just high levels, but a sharp reversal in margin debt. In 2022, margin debt fell more than 20% year-over-year, coinciding with the S&P’s worst year since 2008.
- As of mid-2024, margin balances are creeping higher again, tracking the stock market’s rebound. That suggests speculative leverage is back.
Combine this with stretched valuations (the S&P 500’s forward P/E ratio is above its 25-year average of ~16) and rising household exposure to equities (near record highs), and the setup looks eerily familiar.
Why Investors Can’t Ignore This
The lesson from 1929, 2000, 2008, and 2021 is clear: markets don’t collapse out of thin air. They collapse when excessive leverage turns a correction into a cascade.
This is why margin debt is the silent, but powerful, predictor. It doesn’t just measure bullishness—it measures the fragility of the system.
What Smart Investors Should Do
If history repeats, margin debt trends could once again foreshadow trouble. Here’s how investors can prepare:
- Track FINRA margin debt reports monthly. They’re publicly available and updated regularly.
- Watch for sharp declines. A 10–20% drop in margin debt year-over-year has historically aligned with market downturns.
- Avoid overleveraging. If professional investors get margin-called, retail traders with borrowed positions will be hit even harder.
- Hold cash or hedges. Liquidity becomes king when forced selling drives stocks lower.
The Bottom Line
Every crash leaves investors asking why they didn’t see it coming. But the truth is, the signs were always there.
Margin debt—the silent indicator—has whispered warnings before every U.S. market collapse for nearly a century. Today, it’s whispering again.
You don’t need to predict the exact day of the next downturn. You just need to recognize when risk is building. And history says: when investors borrow too much to chase returns, the story never ends well.
The question is—will you listen to the whisper before it becomes a scream?


